A research and education platform for the solar system's small bodies — the asteroids, comets, and Kuiper Belt objects left over from planet formation, which offer clues about the origin of the Earth and the solar system. Based on a NASA catalog of 1,557,369 objects, with interactive data-mining tools and simulations. We plan to develop an observing programme aimed at using commercially-available astrophotography equipment to measure rotational light curves and other properties of these fascinating objects. Every line of code, every figure, and every page here was developed in collaboration with Anthropic's Claude Code, making the project a working demonstration of what AI can do in a real scientific domain.
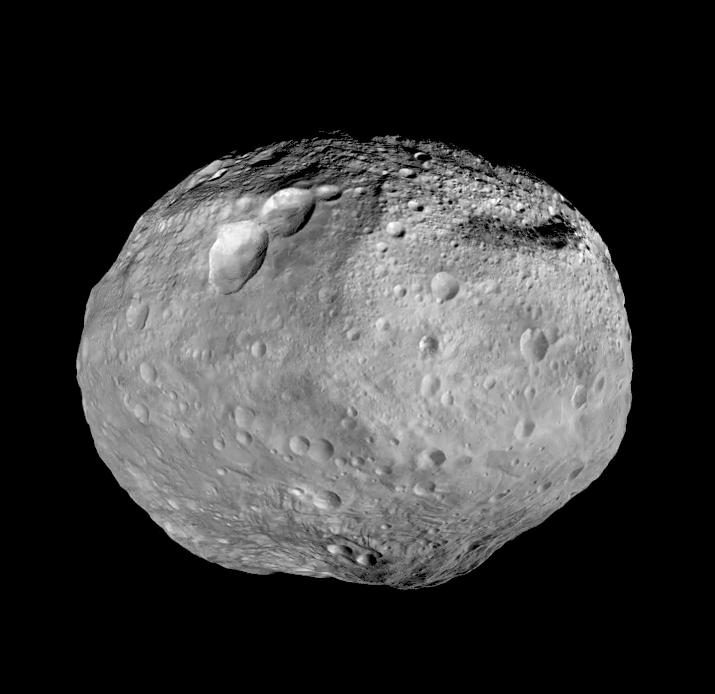
4 Vestamain belt · Dawn
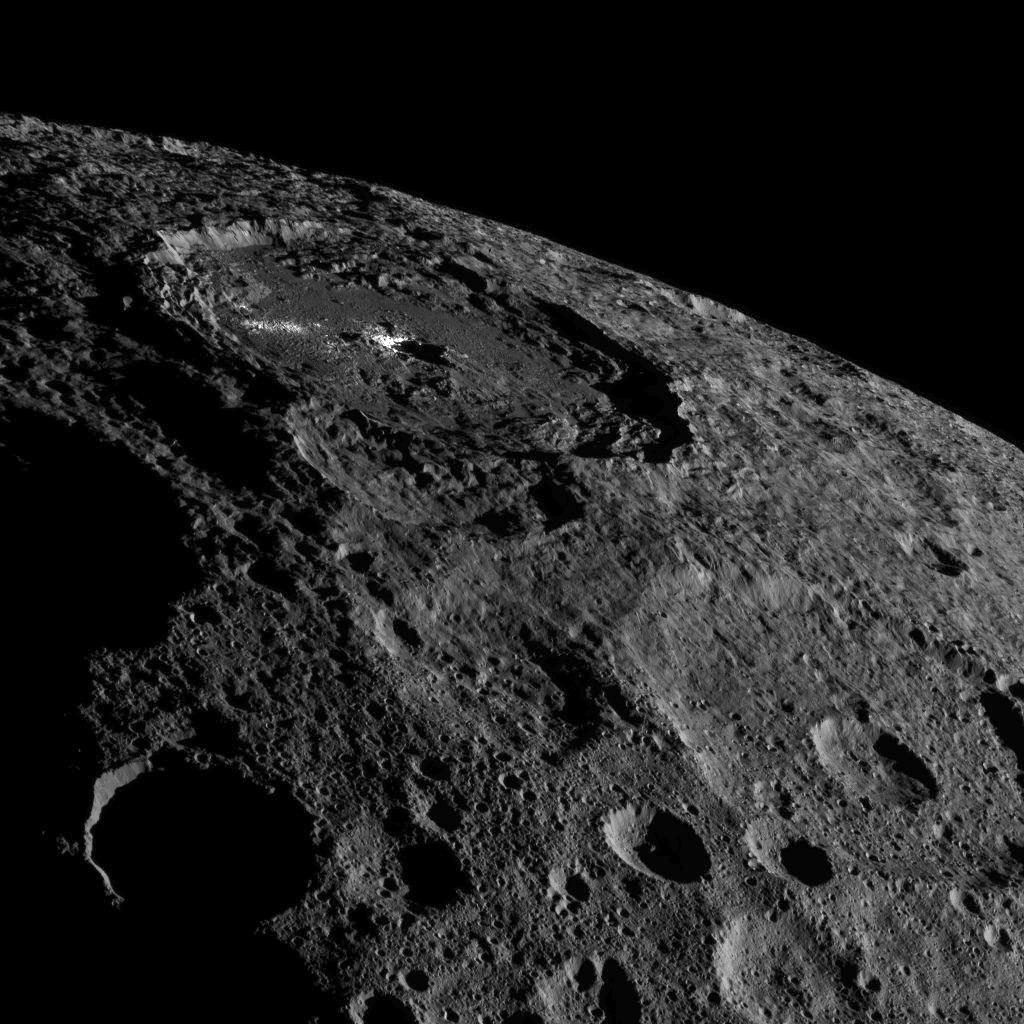
1 Ceresdwarf planet · Dawn
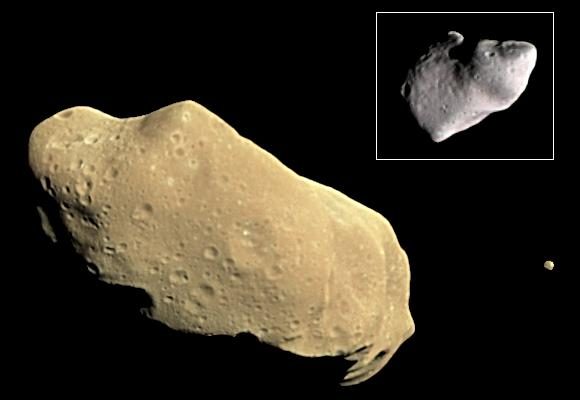
243 Ida & Dactylhas a moon · Galileo
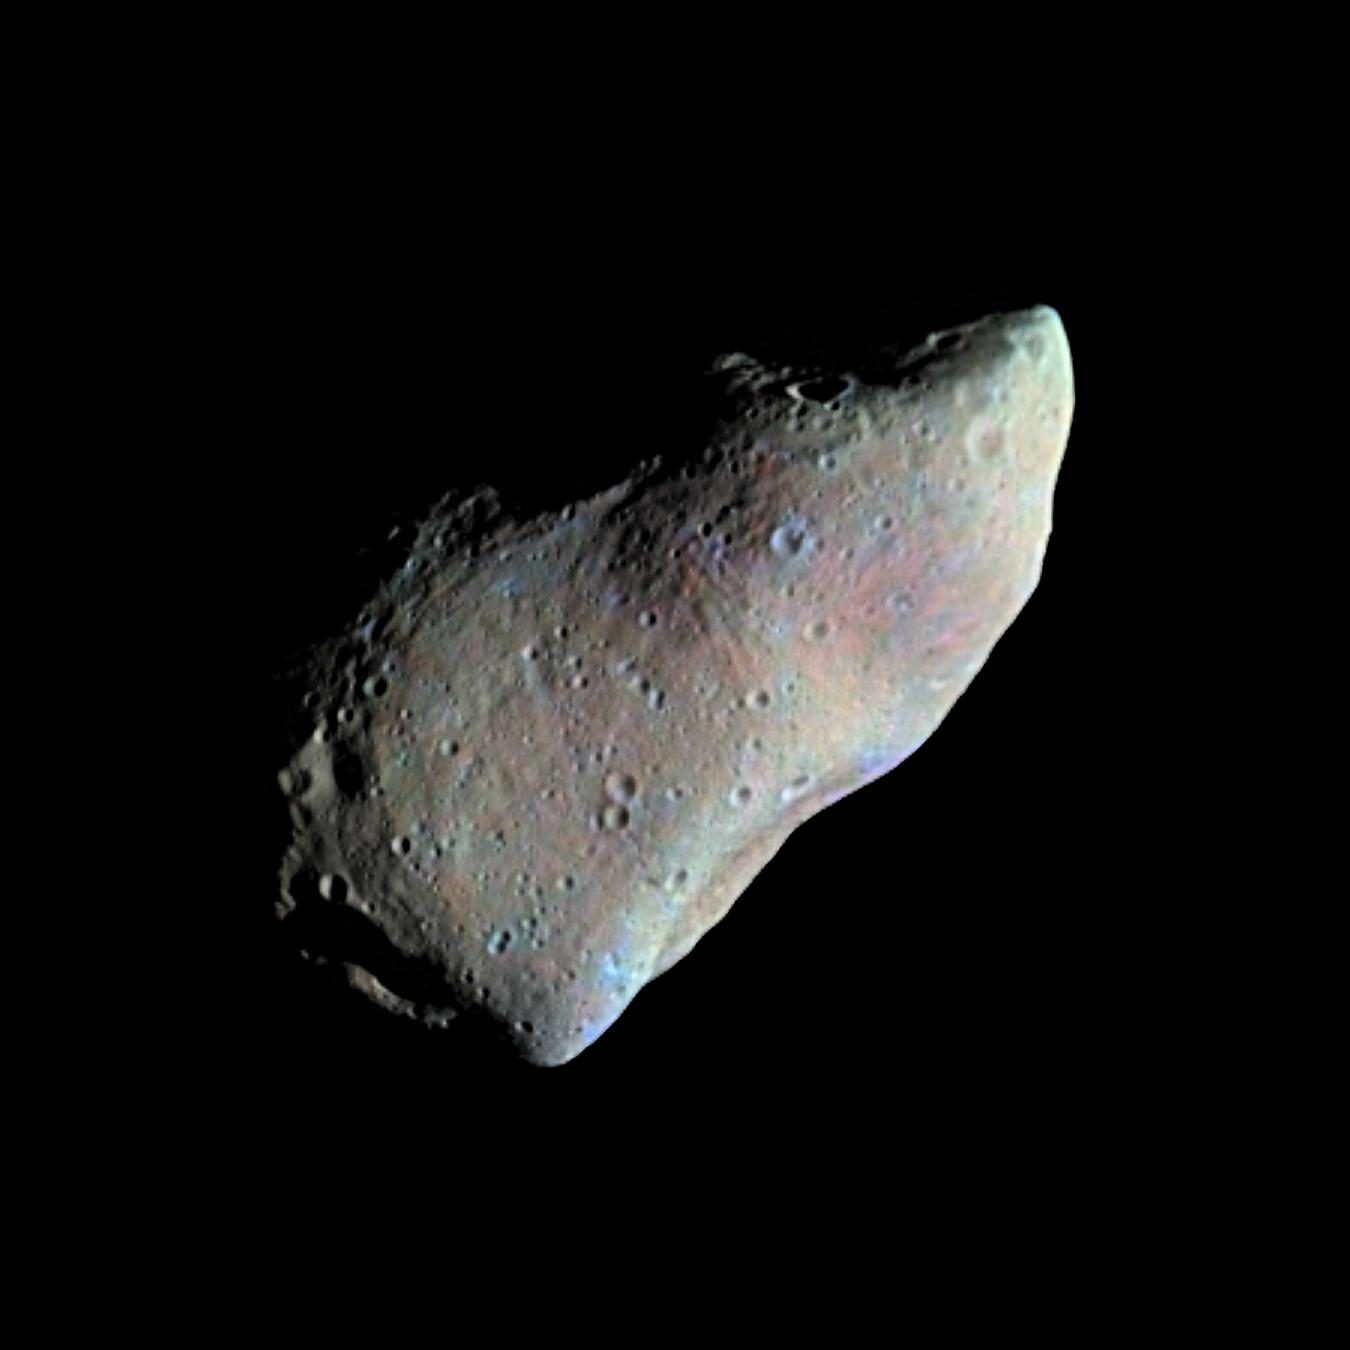
951 Gasprafirst seen close up · Galileo
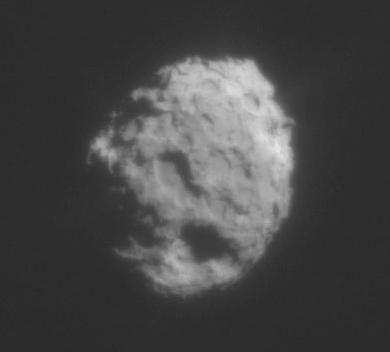
81P/Wild 2comet nucleus · Stardust
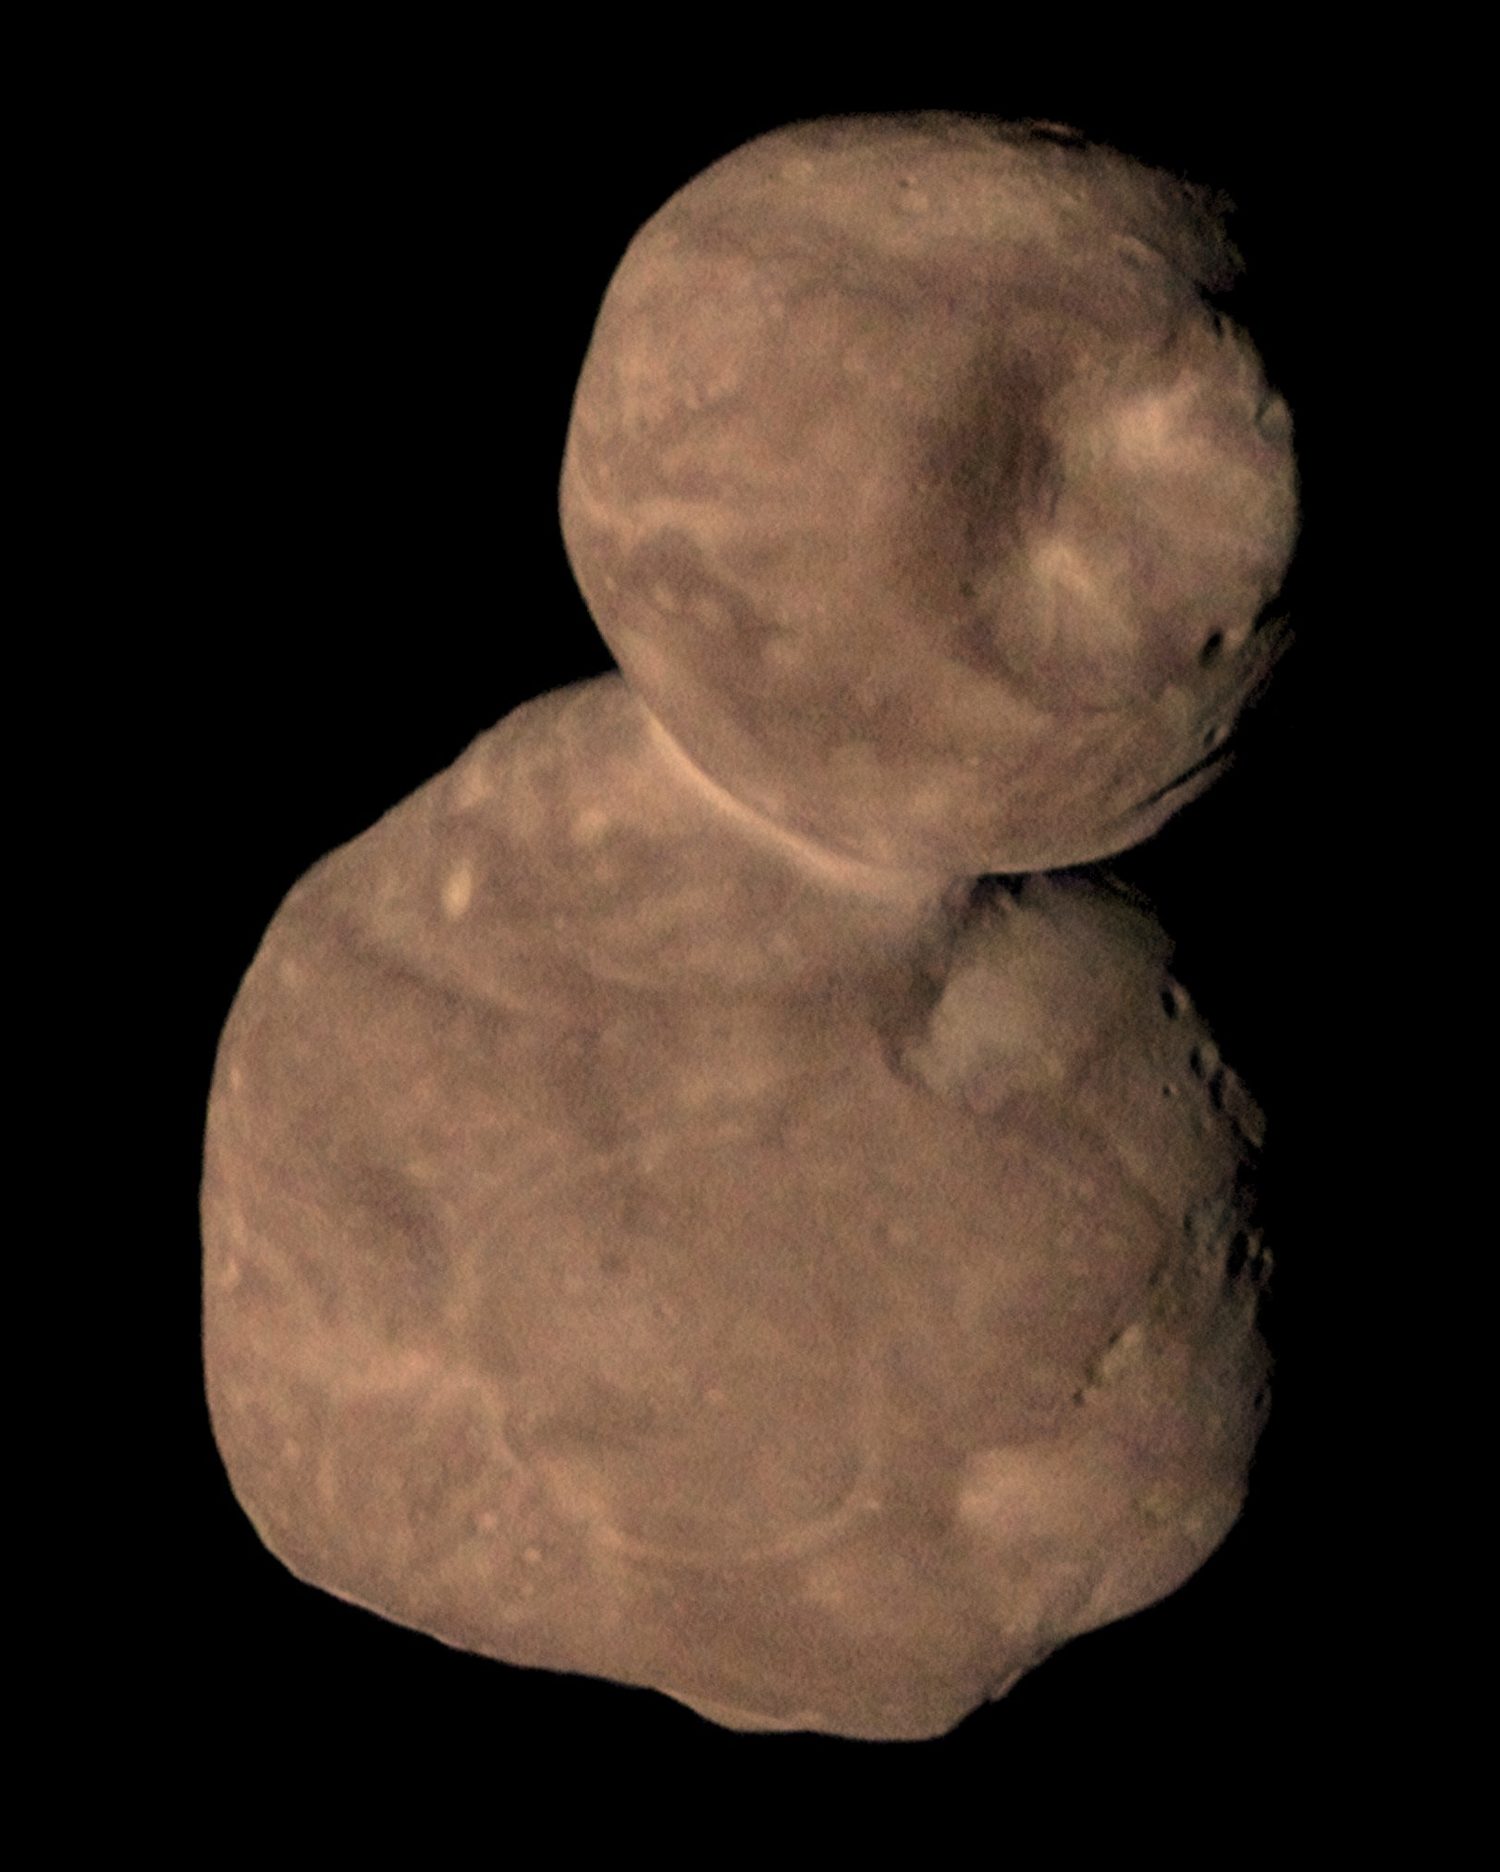
486958 ArrokothKuiper Belt · New HorizonsEvery one of these is a photograph taken by a spacecraft that went there. Images: NASA/JPL-Caltech, JHUAPL/SwRI, UCLA/MPS/DLR/IDA, USGS — public domain.
The planets have spent four and a half billion years remaking themselves. Their interiors have melted, their surfaces have been resurfaced, and whatever they were originally built from has been thoroughly overwritten. The small bodies have not. They are the unprocessed material the planets formed from, and they still carry the record.
That record is readable in three ways. Where they are tells us how the giant planets moved, because the gaps and clusters in their orbits are the fingerprints of resonances that Jupiter and Neptune swept through the disk. What they are made of tells us the temperature at which they condensed, and how far material was transported. And how they spin tells us whether they are solid rocks or loose piles of rubble — which decides what happens if we ever need to move one.
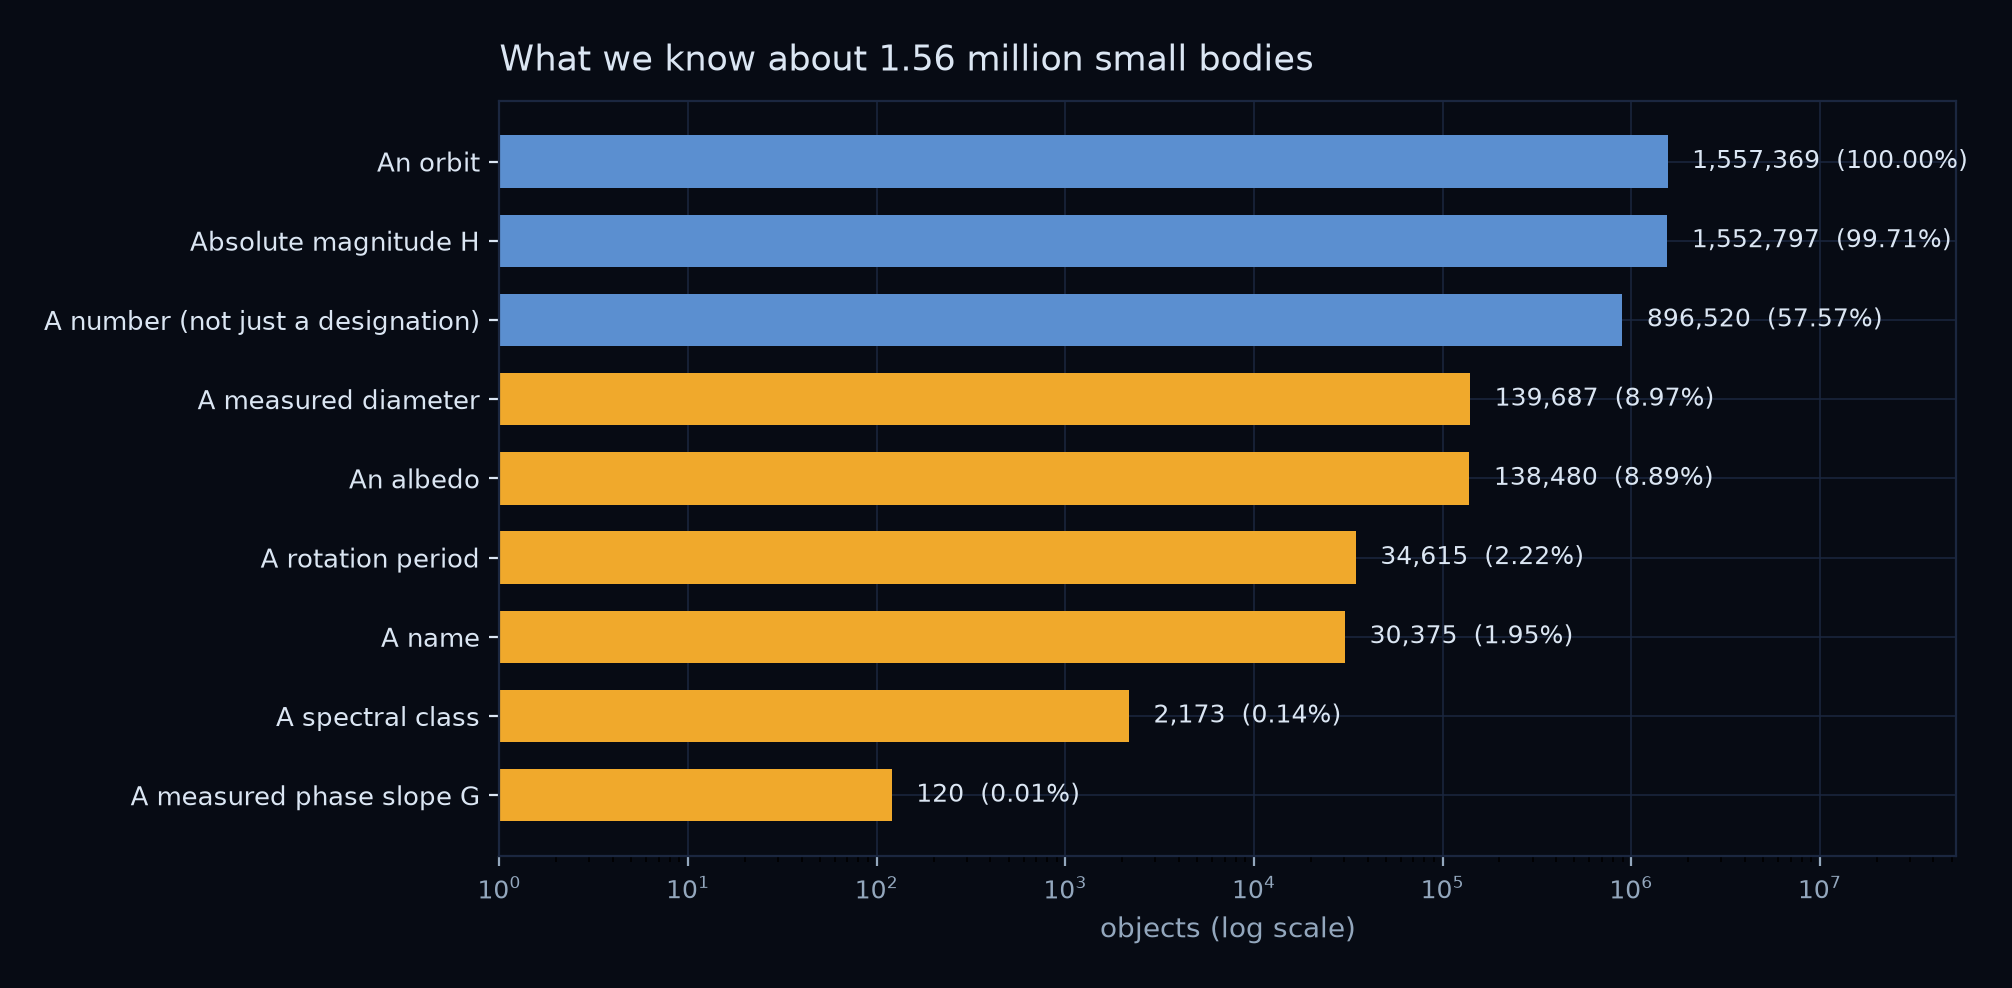
The catch is that we know where far better than we know what. Orbits are essentially complete: 99.71% of the catalog has a brightness and an orbit. But only 8.97% have a measured diameter, 2.22% a rotation period, and 0.14% any measurement of what their surface is made of.
G, published
for just 120 objects out of 1,557,369, is nearly open
ground.Small bodies are classified on two independent axes: where the orbit puts them and what the surface is made of. The dynamical families below are the ones worth knowing by name — each has its own page with the physics that makes it distinct, and figures derived from the mining of our database.
Asteroids whose orbits bring them inside 1.3 AU of the Sun — close enough to cross our neighbourhood, close enough to reach with a spacecraft, and close enough to matter.
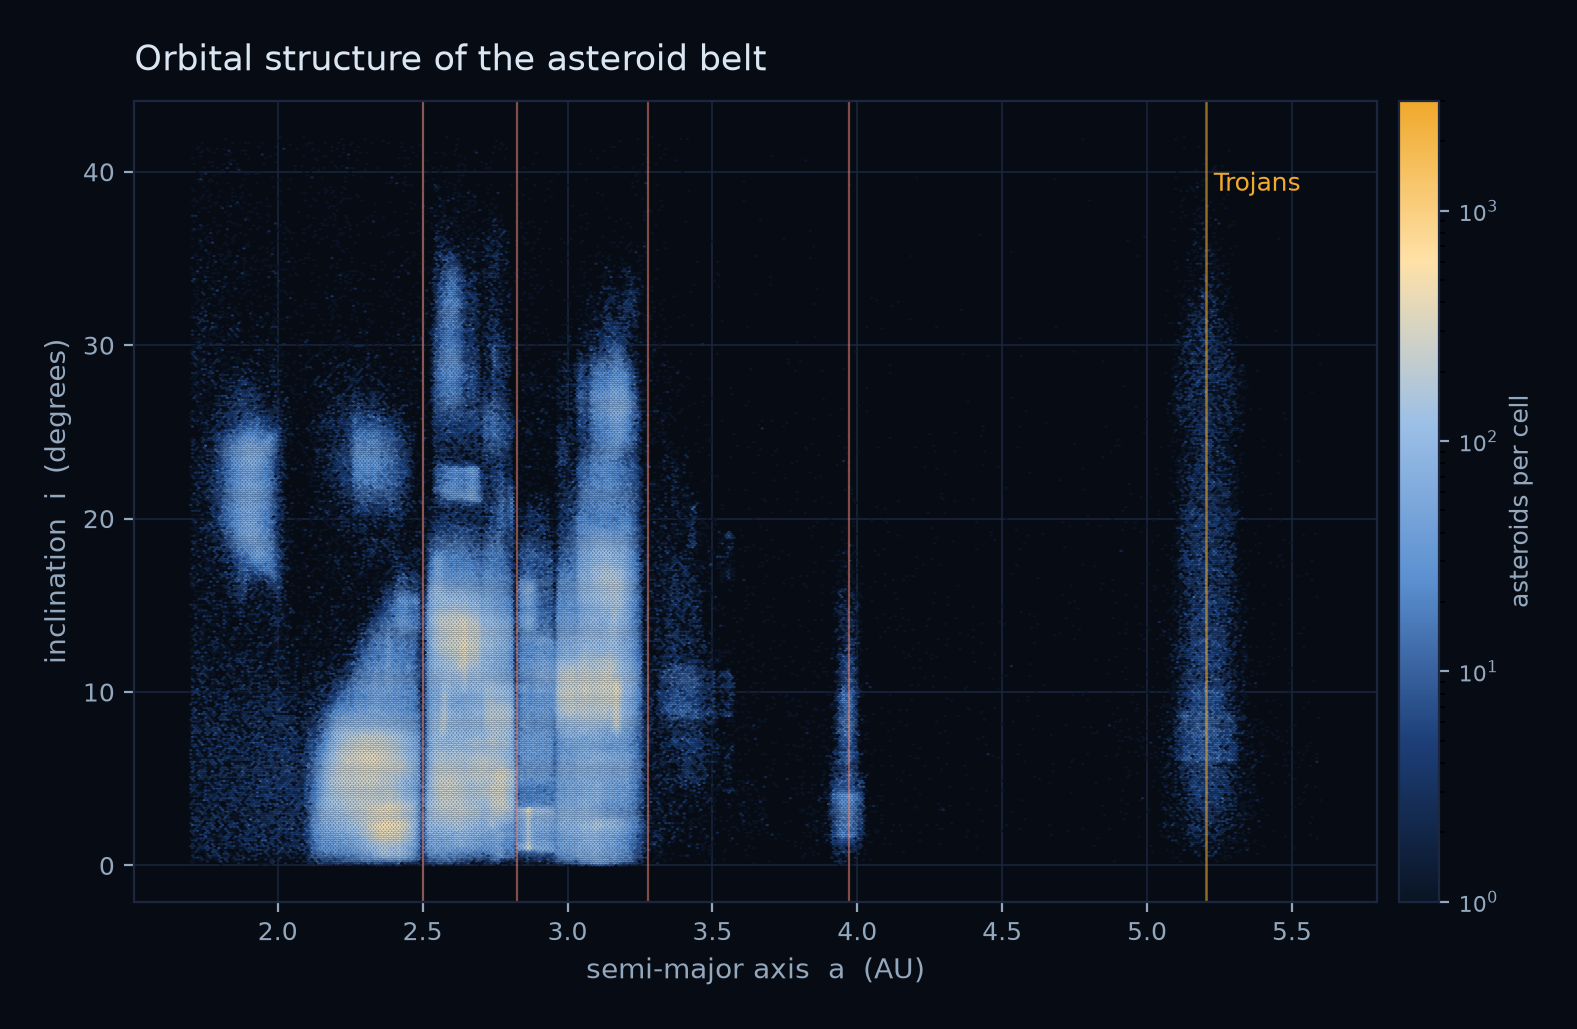
Between Mars and Jupiter lies the solar system's rubble field: 1,457,561 known objects, 94% of everything in this catalog.
Two swarms of dark asteroids ride Jupiter's orbit, 60 degrees ahead and 60 degrees behind, locked in place by the geometry of three bodies moving under gravity.
Objects on unstable orbits among the giant planets: too far out to be asteroids, too close in to be Kuiper Belt objects, and not gravitationally safe anywhere.
Beyond Neptune the solar system does not end; it becomes a disk of icy bodies that never assembled into a planet.
Small bodies that hold onto their volatiles until sunlight drives them off.
Five bodies are officially dwarf planets: massive enough that their own gravity pulled them round, but not dominant enough to have cleared their orbital neighbourhood.
Nearly a third of all known comets are pieces of the same object.
The compositional axis — the C, S and X complexes and their subclasses — is laid out on the taxonomy page.
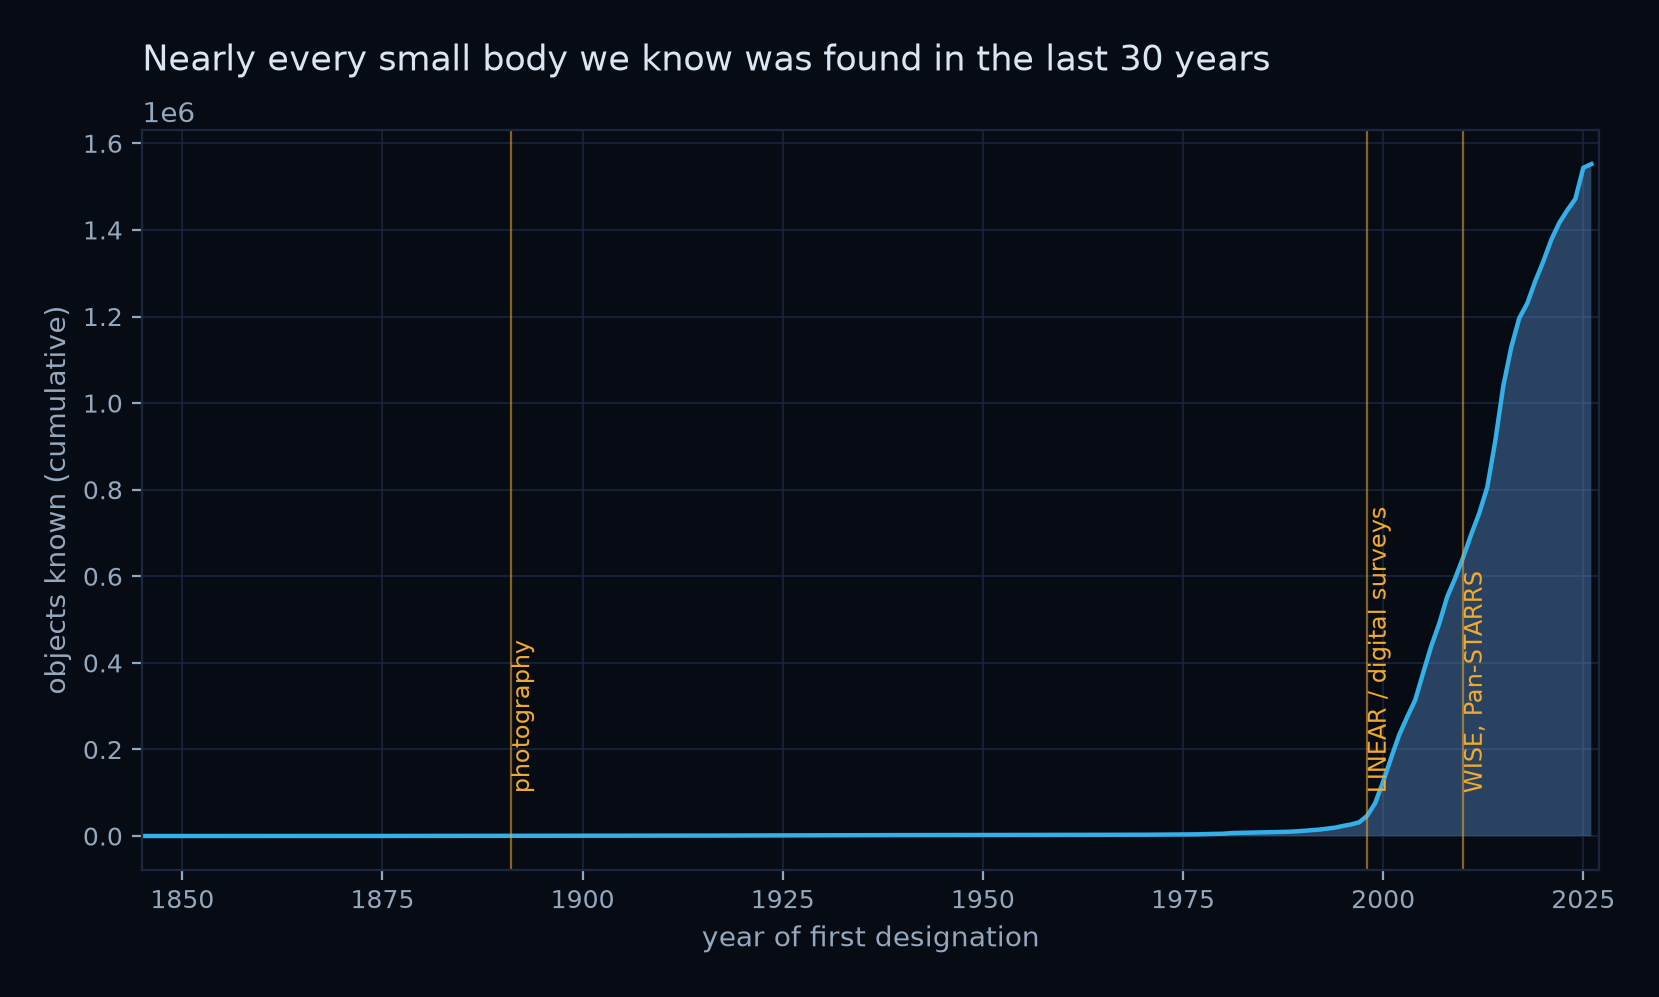
Two centuries of small-body astronomy in two readable pieces — one on the whole arc from Piazzi to the automated surveys, one on the single most famous discovery in it, made at the observatory this project observes from.
From a missing planet and an accidental find on New Year's Day 1801, through photography and CCDs, to surveys that log hundreds of new objects on a clear night. Mostly a history of detectors.
A 24-year-old with no degree, a blink comparator, and a prediction that turned out to be wrong. Plus our own images of the discovery field, taken 96 years later — in which Pluto no longer appears.
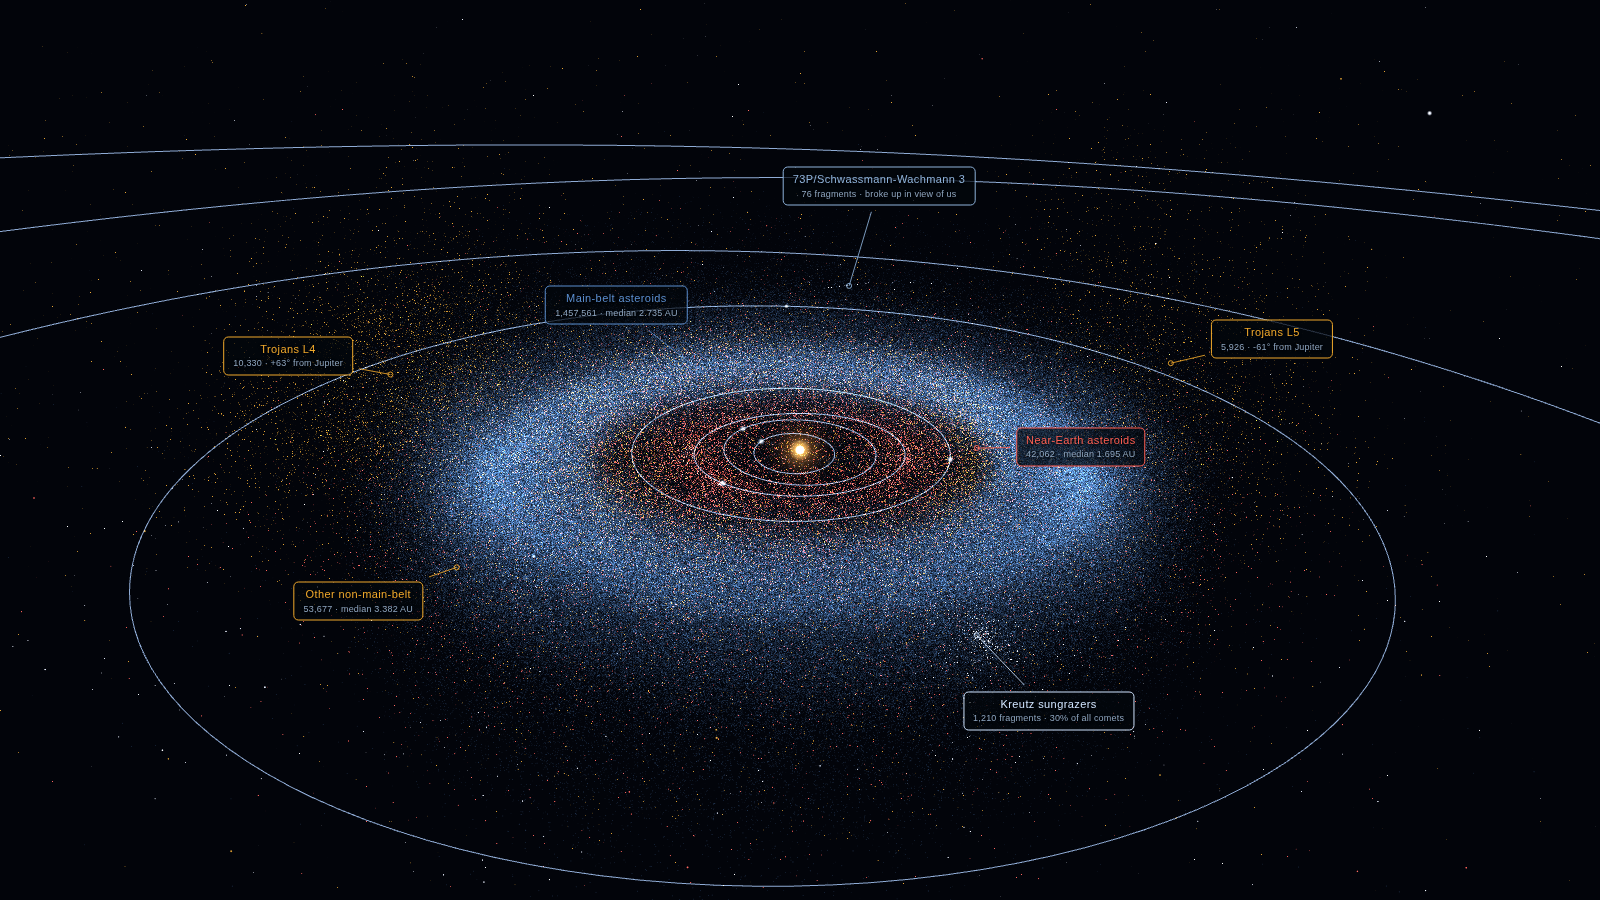
All 1,557,369 objects, placed where they were at a single instant, as a rotatable point cloud that runs in the browser with no plugin and no server. Isolate any population, tilt the belt on edge to see its thickness, and watch Jupiter's Trojan camps separate out 60 degrees ahead of and behind the planet.
The whole catalog as a rotatable point cloud. Isolate any population, tilt the belt on edge, find the Trojan camps. Runs in the browser with no plugin.
A three-body model of the Earth–Moon system with solar tides. Aim an asteroid and see whether Earth can hold on to it. Most attempts fail — which is why temporary moons are rare.
To be clear about what is ours and what is not: the measurements are
not ours. Every orbit, brightness, diameter and spectral class comes from NASA/JPL's
Small-Body Database, which in turn aggregates work by thousands of astronomers and the
Minor Planet Center. What we built is the database around them — the schema,
the taxonomy, the ingest that resolves the source's quirks, and the tools that mine the
result. 1,557,369 objects, snapshot 2026-07-29, rebuilt from
scratch each release.
The guiding rule is that the semantic model must not replicate the distribution format: every flag-dependent field is resolved into explicit columns at ingest, and nothing unrecognised is silently dropped.
Two examples of why that matters. The near-Earth flag means different things for asteroids and comets, and a blank value means "not applicable" in one case and "never assessed" in the other — so the catalog records 37,506 objects as hazard not determined rather than quietly counting them as safe. And the two spectral taxonomies in common use have opposite grammars: in the Tholen system multiple letters mean an ambiguous classification, while in the Bus system they name a single subclass. Reading one with the other's rule invents data.
The pipeline has three stages and no hidden state. A snapshot is downloaded verbatim and hashed; the build parses it into a semantic model; validation re-checks the result and writes a report that leads with whatever it could not understand. Same snapshot plus same code gives the same database, every time.
The JPL Small-Body Database is pulled in full and stored exactly as served, with a SHA-256 of the response and the query that produced it. The raw layer is never queried — it exists so any build can be reproduced.
Identity, orbit, photometry and physical properties are separated; both spectral grammars are parsed into ranked alternatives; two taxonomies get closure tables so a hierarchy-aware count is one join. Written atomically.
Fifteen integrity checks on referential consistency and physical plausibility, plus a parse-coverage report naming every value the build could not resolve. A failure exits non-zero rather than shipping.
The science goal is to add measurements where the catalog is thin: rotation periods from light curves, phase curves for absolute magnitudes, and astrometric follow-up of new near-Earth objects. The photometry pipeline is shared with The Variable Zoo Project, which has been reducing variable-star observations for some time; adapting it to targets that move is the next engineering step. No Rocks in Space observations have been published yet, and this page will say so until they have.
What we plan to measure, and why a 60 mm refractor can do it → — with real published rotation curves, the physics behind their shapes, and the target list.
Rocks in Space is, deliberately, a demonstration of AI-driven scientific research. The catalog schema, the orbit solver, the visualisations, the figures, and every page on this site were developed in a sustained collaboration with Anthropic's Claude Code. We are up front about it because it is the point: a working example of what a human–AI partnership can accomplish in a real scientific domain, with the working shown.
Sets the scientific direction and the questions worth asking, runs the telescopes, supplies the domain judgment, and decides what is real and what is worth pursuing.
Designs and builds the catalog, writes and debugs the code, derives the orbits, draws the figures, and writes these pages — under continuous human review.
Whether an AI collaborator can do real scientific software engineering — not autocomplete, but design decisions, data modelling, numerical work, and the judgment to say "this source field does not mean what it looks like".
The interesting evidence is not the volume of code but the mistakes that got caught. A diagram that rendered at two points and was unreadable. A canvas silently drawing into a 300×150 box in the corner of the screen. An orbit check that failed until it was traced to four-significant-figure rounding in the source data rather than a bug in the code. An image ID that turned out to be a photograph of Martian sand dunes instead of the asteroid it claimed to be. Each was found by looking at the output rather than trusting it.
The verification story matters more than the line count. Positions in the 3-D viewer were checked object by object against JPL Horizons. Jupiter's Trojans emerging in two camps at exactly ±60° of the planet's longitude was never programmed — it falls out of the orbital mechanics, which makes it a test that breaks loudly if the pipeline is wrong. Claims on this site are meant to be checkable, and where something is uncertain it is labelled uncertain.
Rocks in Space is the sibling of The Variable Zoo Project, which applies the same approach to variable stars — a survey of pulsating, erupting and eclipsing stars built on a 10.3-million-object catalog, with the same small telescopes and the same AI-collaborative method. The two projects share a photometry engine and a philosophy; the science is entirely different. If you find this interesting, start there too.
Rocks in Space is a personal research and education project by John Rachlin, a faculty member at the Khoury College of Computer Sciences, Northeastern University, observing from Lowell Observatory in Flagstaff, Arizona (AAVSO observer code RJOJ). It grew out of The Variable Zoo Project when it became clear that the same instruments and the same pipeline could be pointed at targets that move.
The aims are threefold: build an open, well-modelled catalog of the solar system's small bodies; contribute real measurements where the professional surveys have left gaps; and make the whole thing legible to students and to anyone curious enough to click through. Everything here is free to read and free to reuse with attribution.
Corrections, questions, and collaboration are all welcome — particularly from anyone with a telescope who wants to help fill in the gold bars in the chart above. Write to [email protected].
This site talks about "the database", so it is worth being precise about what that means. Rocks in Space holds no original measurements. The database is an integration of public sources:
What is ours is the schema and the integration: a semantic model that resolves the sources' ambiguities instead of copying them, a two-axis taxonomy with hierarchy-aware counts, and the visualisation and data-mining tools built on top. When a page says a figure was derived from our database, it means we mined those public measurements — not that we made them.
Orbital elements and physical parameters come from the NASA/JPL Small-Body Database; planetary positions from JPL Horizons; designations and discovery data from the Minor Planet Center. The physical measurements this catalog aggregates were made by thousands of astronomers over two centuries. This project organises their work; it did not do it.